Conventional 2D application areas

Nuclear identification

OmniSphero comprises a classical watershed algorithm to identify nuclei and to obtain information like position of the centroid of the nucleus on the image, nucleus area and intensity. The coordinates of the nuclei centroids are later used to associate a certain nucleus with a cell type (e.g. neurons). Additionally OmniSphero is able to import coordinates of nuclei from other software and to use for analyzing other endpoints such as neuronal identification or radial migration distance. In the case of neuronal identification this allows OmniSphero to perform a one by one comparison of identified nuclei positions associated to neurons between its own algorithms and algorithms of other software.

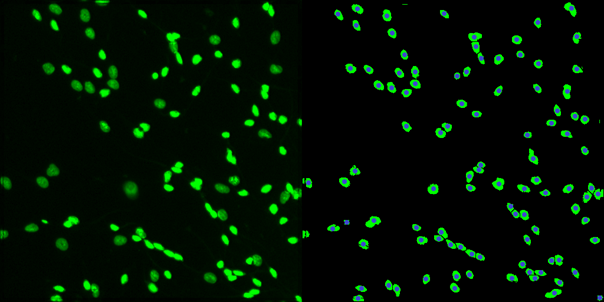
The left image shows an image from the nucleus channel (Hoechst stained nuclei, represented in green).

Figure 3: The left image shows an image from the nucleus channel (Hoechst stained nuclei, represented in green). The image is thresholded converted to a binary image and consequently a watershed algorithm is used to segment overlapping nuclei. Finally coordinates of centroids of identified nuclei are safed and can be displayed as a blue points cloud.

Neuronal identification/quantification

Manual

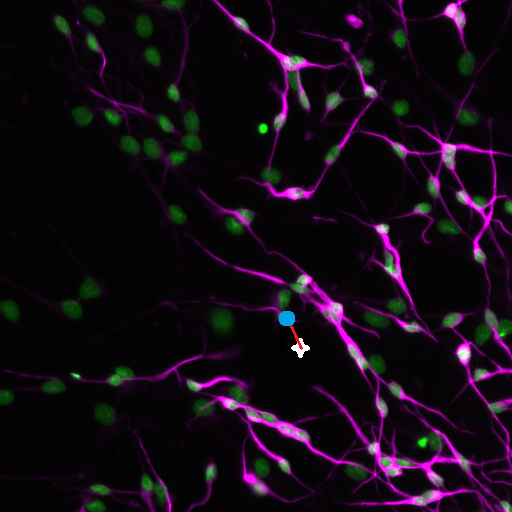
OmniSphero provides the user with a manual counting tool, to manually quantify neurons. This counting tool, saves all coordinates of the user defined neurons by mapping the clicking position to the closest surrounding nucleus.

The user clicked position is shown as a white cross and is automatically mapped to the closest nuclei (blue dot)

Figure 4: The user clicked position is shown as a white cross and is automatically mapped to the closest nuclei (blue dot)

Automated evaluation with classical image analysis

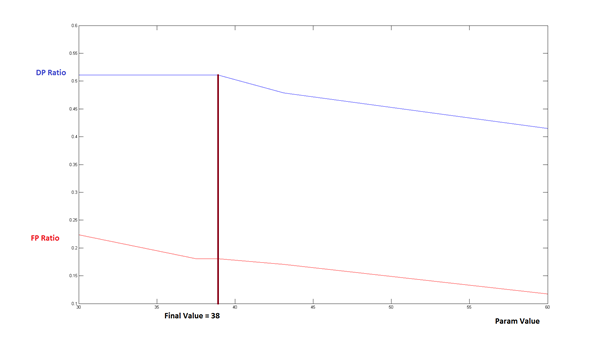
OmniSphero comprises a self-developed algorithm called ‘Neuronal Tracer’ to quantify neurons in a heterogeneous cell population with varying cell densities. Most software requires the user to adjust multiple parameters on several sample images to optimize shape recognition, which results in a time consuming optimization procedure. Therefore, we implemented a new concept in ‘OmniSphero’, in which the user defines a neuron by manual assignment rather than by defining an object over parameter settings using the manual counting tool described above. Consequently, the program optimizes automatically all parameters to fulfill a user-defined maximal false positive (FP)-rate.

Optimization of one parameter within in the multiparameter analysis (here minimal skeleton length in pixel). The parameter is iterated until the best ratio between true positives (Detection power (DP)) and false positives (False positive (FP)-rate) is achieved, without extending the FP-rate above the maximal user defined value.

Figure 5: Optimization of one parameter within in the multiparameter analysis (here minimal skeleton length in pixel). The parameter is iterated until the best ratio between true positives (Detection power (DP)) and false positives (False positive (FP)-rate) is achieved, without extending the FP-rate above the maximal user defined value.

Results can be plotted as dose response curves to study the dose dependent effect of a substance on neuronal differentiation. Additionally coordinates of neurons obtained by other software can be imported into OmniSphero and DP and FP-rates can be analogous obtained by comparing them to the manually identified coordinates

Comparison of different automated methods in terms of accuracy and precision to identify neurons. In the left image dose response curves are shown in red blue and magenta for automated methods and in black for the manual evaluation as gold standard.

Figure 6: Comparison of different automated methods in terms of accuracy and precision to identify neurons. In the left image dose response curves are shown in red blue and magenta for automated methods and in black for the manual evaluation as gold standard. Additionally the influence on viability is shown in grey. The middle and right image show the DP and FP-values for the corresponding algorithms.
Automated evaluation : Neuronal Networks

With the latest version of OmniSphero, machine learning has been integrated. As such, nuclei can now automatically be preprocessed for two different machine learning models to classify each nucleus based on its morphological context as Oligodendrocyte and Neuron.

These models were trained and evaluated on image data previously obtained and annotated using OmniSphero. With this integration, evaluation speed has been increased and workflows automated further.
The integration of CNN models has been thoroughly established in, and is accessible directly from within OmniSphero. Potential models can be directly provided with preprocessed training data generated in a high throughput fashon. Compatible deep learning model candidates and their corresponding nuclei predictions can also be evaluated and their accuracy measured from within OmniSphero.

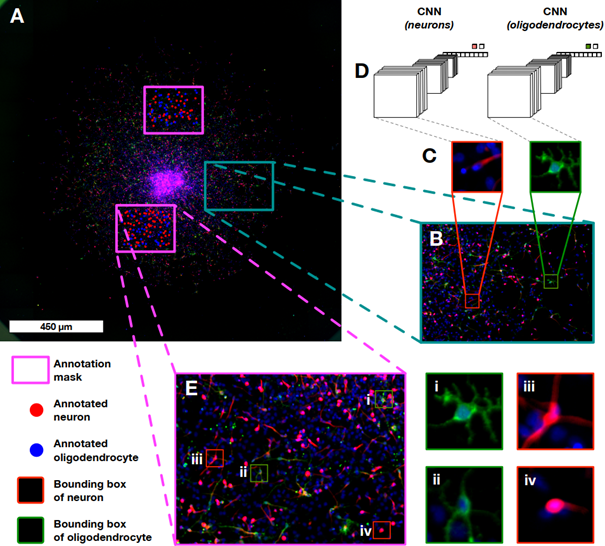
hNPCwere treated as described in Section2.1.Pseudo-colored composite mages were created by overlapping the Hoechst33258 (nuclei, blue),TUBB3 (neurites, red) and O4 (oligodendrocytes, green) antibody stainings.

Figure 7: hNPCwere treated as described in Section2.1.Pseudo-colored composite mages were created by overlapping the Hoechst33258 (nuclei, blue),TUBB3 (neurites, red) and O4 (oligodendrocytes, green) antibody stainings. For every nucleus within a ROI contained in the neurosphere image (A) contained within the migration area, a 64x64 pixel tile is created with the corresponding nucleus at the center. (B) shows two examples, representing eurites (left) and oligodendrocytes (right). Every tile (C) has the unused color channel removed and a manual color adjustment is applied to each.(D) shows both tiles being loaded into the corresponding CNN. The CNNs were trained based on annotated subregions throughout a large number of wells, as exemplified in (E), where also four annotated cells are highlighted.

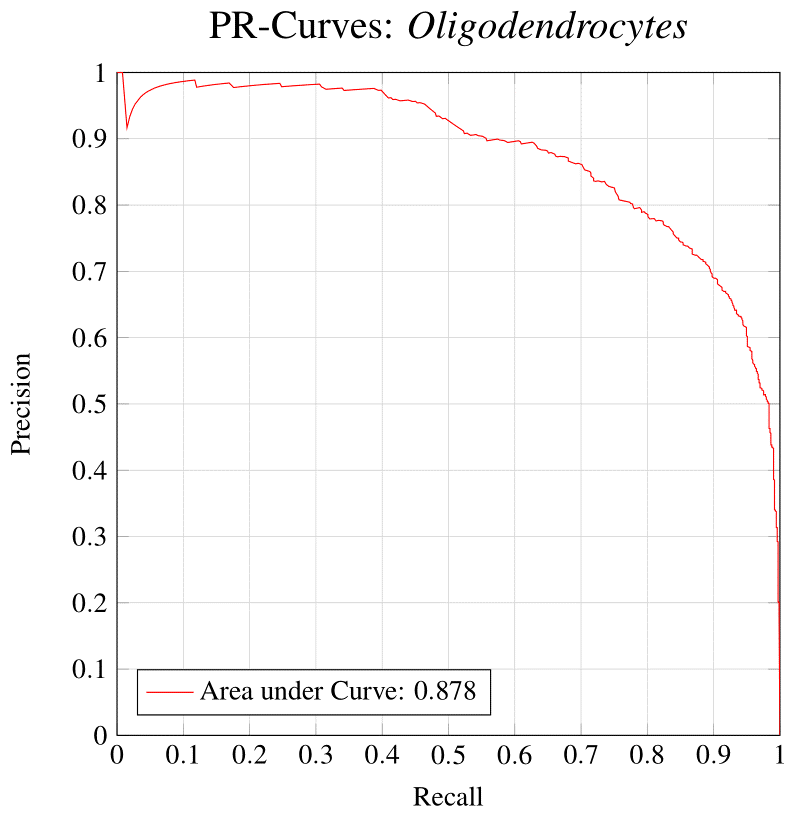
PR-Curves - Oligodendrocytes
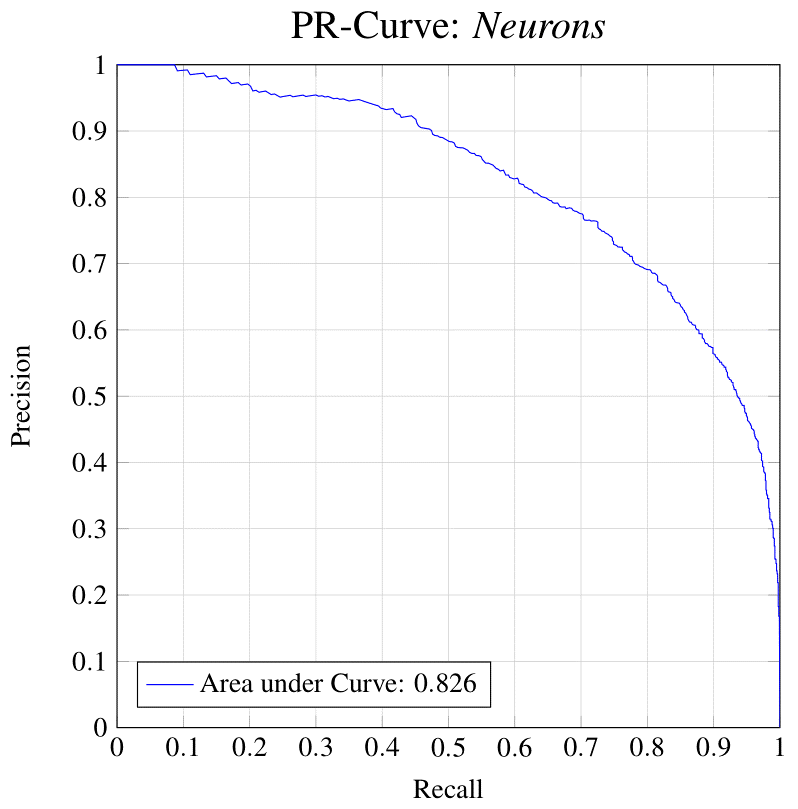
PR-Curves - Neurons

Figure 8: Prescision-Recall curves of the models used for nucleus classification.

Visualization

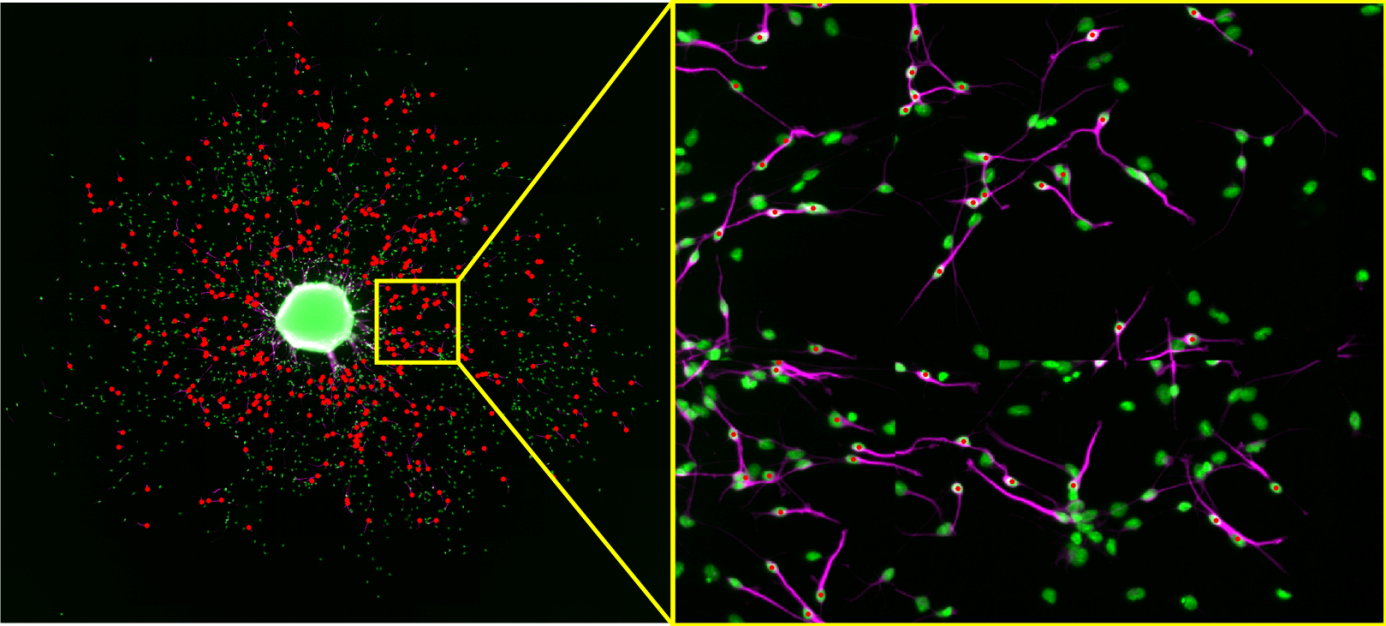
Within the users interface of OmniSphero it is also possible to judge the quality of an automated evaluation by visualizing the coordinates of identified neurons on the overview image.

The left image shows the point cloud of all identified neurons of an automated evaluation. Within the user interface it is possible to zoom into certain regions to judge how accurate the neuronal identification performed.

Figure 7: The left image shows the point cloud of all identified neurons of an automated evaluation. Within the user interface it is possible to zoom into certain regions to judge how accurate the neuronal identification performed.

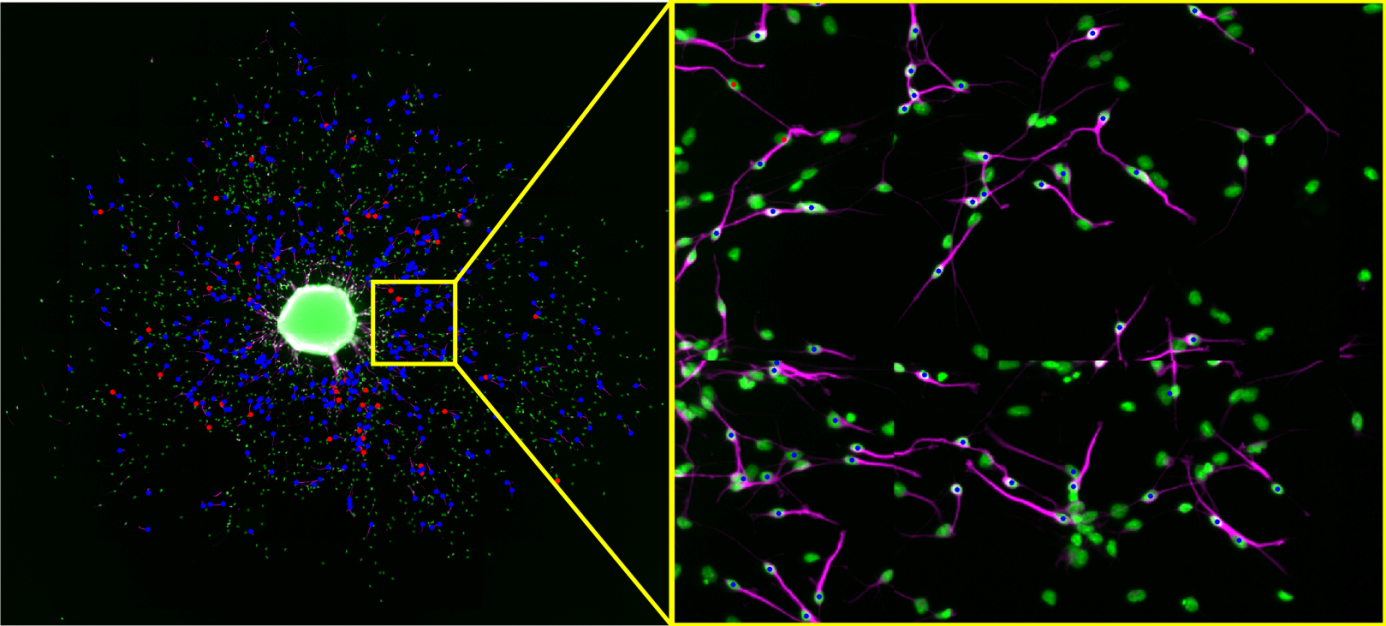
It is also possible to display the coordinates of two algorithms or of one algorithm and a manual evaluation at the same time in different colors.

The left image shows two point clouds of all identified neurons of an automated evaluation (red) and a manual evaluation (blue). Since equal positions are overlapped (red dots are overlapped with blue dots), the user is able to see coordinates of falsely identified neurons, and again a close up (right image) helps to judge the quality of the automated evaluation.

Figure 8: The left image shows two point clouds of all identified neurons of an automated evaluation (red) and a manual evaluation (blue). Since equal positions are overlapped (red dots are overlapped with blue dots), the user is able to see coordinates of falsely identified neurons, and again a close up (right image) helps to judge the quality of the automated evaluation.

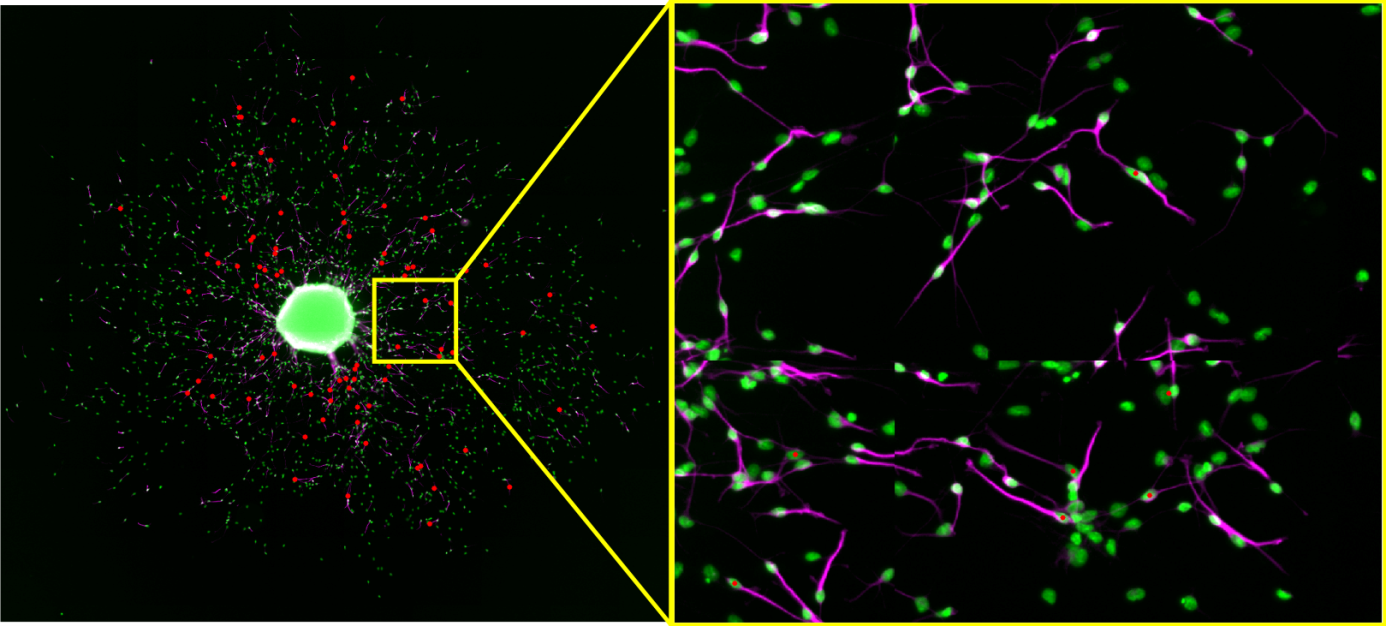
Additionally it is possible to display only those manually chosen neurons which are not identified by an automated evaluation (false negatives)

The left image shows positions of non identified neurons (red dots) on the overview image. The left image is a close up of a small extract showing several neurons which were not identified by the algorithm (red dots)or only those which are falsely identified by the algorithm (false positives).

Figure 9: The left image shows positions of non identified neurons (red dots) on the overview image. The left image is a close up of a small extract showing several neurons which were not identified by the algorithm (red dots)or only those which are falsely identified by the algorithm (false positives).

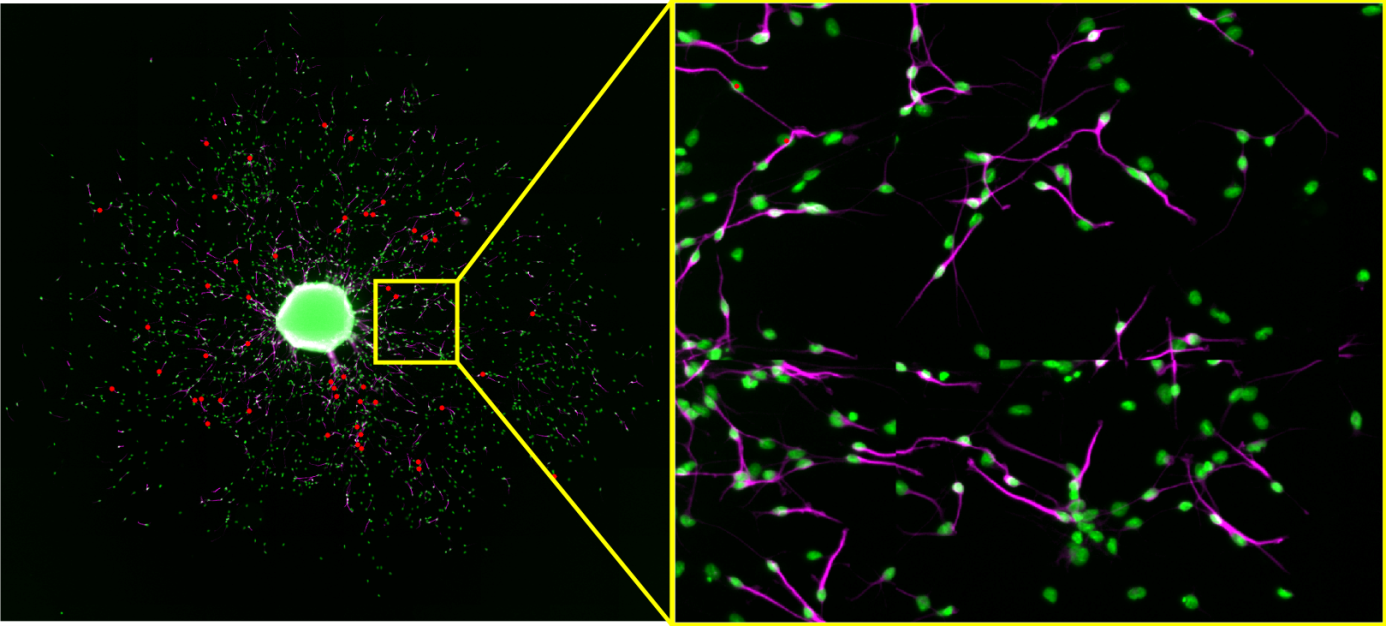
The left image shows positions of falsely identified neurons (red dots) on the overview image. The right image is a close up of a small extract showing several neurons which were identified by the algorithm (red dots), but not by the manual evaluation.

Figure 10: The left image shows positions of falsely identified neurons (red dots) on the overview image. The right image is a close up of a small extract showing several neurons which were identified by the algorithm (red dots), but not by the manual evaluation.

This enables the user to identify limitations of certain algorithms or helps to further improve their software.

Neuronal morphology

OmniSphero enables the user to measure neurite area, neurite length, and number of branching points of either the entire neuron population or of only clearly separated neurite areas consisting of only one or two neurons. 

Endpoints of neuronal morphology which can be assessed by Omnisphero. The green ellipses repsresend the neuron cell bodies. From the border of the cell somas, the neurite length, neurite area and existing branching points were evaluated.

Figure 13: Endpoints of neuronal morphology which can be assessed by Omnisphero. The green ellipses repsresend the neuron cell bodies. From the border of the cell somas, the neurite length, neurite area and existing branching points were evaluated.

The advantage of using only clearly separated areas consisting of one or two neurons circumvents a possible overlap of neurites present in big neurite areas.

TOP