3D- Sphere-specific endpoints

Migration distance

Radial migration is assessed by recognizing the sphere-core and defining it as the inner boarder of the migration area. The outer boarder is calculated by using the density of coordinates of the identified centroids of cell nuclei and the intensity information of the nucleus channel. The migration distance is subsequently calculated as the mean distance between these two boarders. Since only the raw images and the centroids of cell nuclei are required to assess this endpoint, centroids of cell nuclei obtained by different software can be imported in Omnisphero and used for the evaluation.
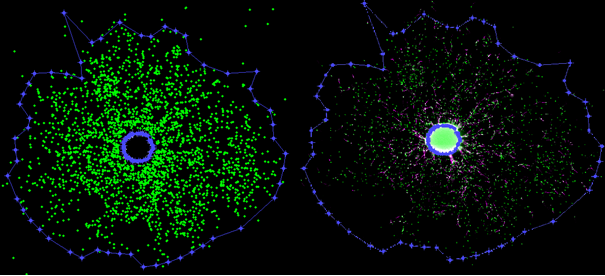
Assessment of the migration distance: The left image shows the point cloud of the centroids of identified nuclei.

Figure 14: Assessment of the migration distance: The left image shows the point cloud of the centroids of identified nuclei. The sphere core is the brightest object within the migration area and is automatically removed by OmniSphero. The removed sphere-core defines the inner boarder of the migration area. The density of nuclei centroids is used to identify the outer boarder of the migration area. The right image shows the resulting mask of the migration area on the original image.
Density distributions

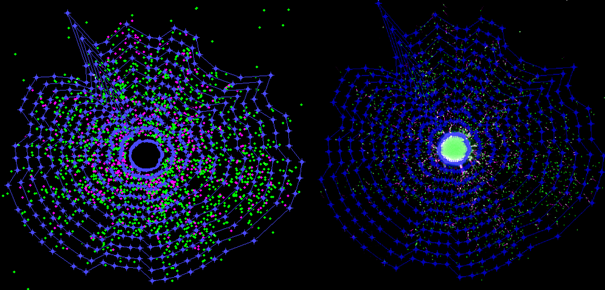
Neuronal density distributions are assessed by using the migration area used for the evaluation of the radial migration, but subdividing it into ten rings with equal with equal thickness. In each ring the number of neurons to the number of cell nuclei is normalized to the ratio within the entire migration area. This results in a distance dependent function of neuronal density. Since only the images, the coordinates of nuclei and neurons are required, again evaluations of different origins can be used to assess these endpoint. Additionally also density distribution of other cell types can be evaluated if coordinates of those can be imported to OmniSphero.

The radial migration distance is defined by the average distance between the rim of the sphere core and the furthest migrated cells (indicated as yellow arrows).

Figure 15: Neuronal density distribution: The left image shows the point cloud of the centroids of identified nuclei (green) and neurons (magenta) overlapped with the mask obtained by the assessment of the radial migration which is subdivided into ten rings with equal distance. For each ring the ratio between neurons and cell nuclei is evaluated and normalized to the average ratio within the entire migration area. This results in a distance dependent density distribution of neurons. The right image shows the overlay of the ring mask with the original image.

TOP