Neurodevelopmental toxicants are a serious risk for society, making regulatory testing for chemicals indispensable. Testing according to the current regulatory guidelines employing animal experiments is time- and cost intensive. For a more resource-effective way of developmental neurotoxicity (DNT) testing we established the human ‘Neurosphere Assay’, which is based on three dimensional (3D) neural progenitor cell (NPC) clusters. This system is able to mimic basic processes of brain development: Proliferation, differentiation, migration and apoptosis. Upon withdrawal of growth factors and in presence of an extracellular matrix (ECM), NPCs start to radially migrate out of the sphere-core and differentiate into neurons, oligodendrocytes and astrocytes maintaining cell-cell and cell-ECM interactions. In immunostained samples different cell types can be quantified and their morphology can be studied using high content image analyses (HCA).
However, safety and efficacy testing of chemicals with 3D neurospheres by employing high content image analyses (HCA) requires advanced scanning and evaluation processes due to characteristic features of the cultures:
- A variable cell density within the migration area
- A 3D sphere core, leading to unfocused images
- A heterogeneous cell population of neurons and glia cells

Figure 1: Challenges of the neurosphere assay: In the center of the image the 3D-neurospere core is represented as a purple spheroid. From this sphere core cells radially migrate out and differentiate into the three major brain cell types: Astrocytes, neurons and oligodendrocytes. HCA of such a system bears several challenges for automated evaluations, such as defocusing problems, due to the 3D sphere core, a variable cell density and a heterogeneous cell population.
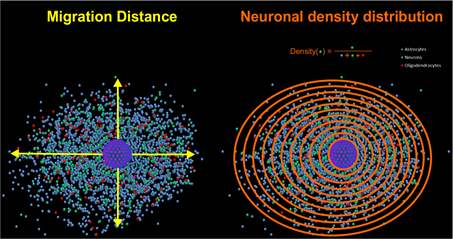
However, these characteristic features open the possibility to analyze sphere-specific endpoints like radial migration distance and cell-type specific density distributions.

Figure 2: The radial migration distance is defined by the average distance between the rim of the sphere core and the furthest migrated cells (indicated as yellow arrows). A density distribution describes the ratio between a certain cell type e.g. neurons (indicated here as green dots) and all present cell types at a certain distance from the sphere-core (indicated as rings, which subdivided the migration area into ten areas with different distances from the sphere-core).
To tackle these challenges we developed a software called ‘OmniSphero’ to assess radial migration, quantification of neuronal differentiation, neurite outgrowth and distance-dependent density distributions.